Price action tells you where the market has been. Order flow tells you who is driving it and how urgently. AIO Terminal's Smart Tape, Aggression Gauge, and Spot/Perp CVD panels bring three of the most powerful real-time flow signals into your execution interface — so you can read institutional activity while your orders are still open.
Why Most Retail Traders Can't See What's Actually Moving Price
The standard retail toolkit — RSI, MACD, moving averages, even volume bars — describes price history. None of these tools tell you whether the $50M market buy that just hit BTC was a hedge fund initiating a long, or an exchange liquidating an overleveraged retail trader's position. Those two events look identical on a candle chart but have very different implications for what happens next.
Market microstructure closes that gap. The three flow tools in AIO Terminal's Analytics tab each answer a different question:
- Smart Tape: Who just traded, and with how much urgency?
- Aggression Gauge: Is the overall market balance tipping toward buyers or sellers right now?
- Spot/Perp CVD: Are futures traders leading or lagging the spot market?
Together, these three signals form a directional picture that price alone cannot provide.
Smart Tape: Filtering for What Actually Matters
The Problem with a Raw Trade Feed
BTC futures on Binance can see 5,000–10,000 individual trades per minute during active sessions. A raw tape is noise. Most of those trades are retail orders — $200, $1,000, $5,000 positions that do not meaningfully move the order book. The traders who move markets execute in $100,000+ clips. Smart Tape filters out everything below your threshold and shows you only those that matter.
How Smart Tape Works
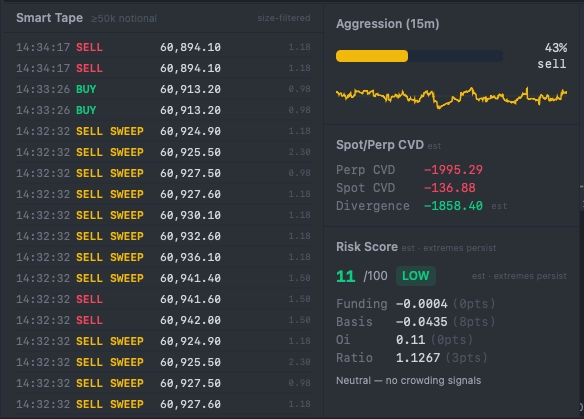
AIO Terminal connects to Binance's real-time trade stream and applies a notional filter (default: ≥ 50,000 USDT per trade). Each qualifying trade appears in the Smart Tape with:
- Direction: BUY (aggressive buyer hitting asks) or SELL (aggressive seller hitting bids)
- Notional size in USDT
- Timestamp
The threshold is a dropdown in the sidebar with five presets: $25k / $50k / $100k / $200k / $500k (default: $50k). Your selection is saved automatically. For BTC, $50k is a solid floor — it eliminates most retail noise. For lower-liquidity perpetuals (SOL, LINK, DOGE), drop to $25k to see flows that are relevant at those asset sizes. For a cleaner view showing only large institutional clips, raise to $100k–$200k.
Sweep Detection: The Highest-Conviction Signal
The most valuable Smart Tape feature is sweep detection. When three or more large same-side trades occur within a 500ms window, the tape flags it as a sweep:
Example sweep sequence (all 3 within 500ms):
12:34:01.123 — BUY $210,000
12:34:01.342 — BUY $180,000
12:34:01.489 — BUY $290,000
⚡ BUY SWEEP detected
A sweep means a participant was willing to pay up — hitting multiple price levels within half a second rather than working a limit order and waiting. This is the signature of a large buyer or seller acting with urgency. The most common interpretations:
- BUY SWEEP at a consolidation breakout: The breakout is momentum-backed. The buyer is not waiting for pullbacks.
- BUY SWEEP into resistance: Someone is testing whether the wall will absorb the pressure. Watch the Order Book bars — if the ask wall doesn't shrink, the buyer will be stopped out.
- SELL SWEEP into support: Aggressive liquidation. If this is a stop-hunt sweep that clears out retail stops and then reverses, the large seller may be establishing a long. If selling continues, the support is failing.
- Multiple sweeps in the same direction over 5–10 minutes: Institutional position building. This is one of the cleaner signals available in real-time flow — a persistent, aggressive buyer or seller is executing a large order over time.
What Smart Tape Does NOT Tell You
Smart Tape shows aggressive (market) orders. It does not show passive (limit) orders — those appear in the Order Book, not the tape. A large trade hitting the tape means someone was willing to pay market prices; the limit book shows where patient money is waiting. Reading both together gives you the full picture: who is aggressive and where the patient money sits.
Aggression Gauge: The Pressure Ratio
What It Measures
The Aggression Gauge calculates the ratio of buy-side aggression to total aggression over a rolling 1-minute window, expressed as a 0–100 score. Every trade in the real-time feed is classified as buyer-initiated (hitting asks) or seller-initiated (hitting bids). The gauge is the proportion that is buyer-initiated.
- Score of 50: Perfect balance — equal buy and sell aggression
- Score of 65+: Sustained buy-side pressure — buyers are the more urgent side
- Score of 35 or below: Sustained sell-side pressure
The gauge updates every ~1 second. Unlike most indicators, it responds in real time — not on candle close. A 1-minute candle's close tells you nothing about whether the aggression at 12:00:15 was buying or selling. The Aggression Gauge tells you both the current state and the trajectory.
The 15-Minute Sparkline
Alongside the current score, the gauge displays a 15-minute sparkline — a small time series of the last 15 minutes of readings. This is critical context. A current reading of 68 means very different things depending on whether:
- The sparkline shows the gauge climbing steadily from 50 → 68 over the last 10 minutes (building momentum)
- The sparkline shows the gauge spiking from 45 → 68 in the last 30 seconds and trending back down (likely transient, may not sustain)
- The sparkline shows the gauge oscillating between 65–72 for the entire 15 minutes (persistent institutional accumulation)
Reading the sparkline prevents you from treating a single-second spike as a signal when the broader context shows it's noise.
Practical Aggression Gauge Setups
Breakout Validation
A price breakout above a key resistance level with an Aggression Gauge reading below 55 is a weak breakout — there is no meaningful buy-side pressure backing it. This is how many false breakouts happen: price crosses the level on low volume or limit-order movement, retail traders chase it, and the lack of aggressive buying means the breakout cannot sustain.
A breakout with Aggression above 65–70 and a sparkline showing sustained pressure for the previous 5–10 minutes is a legitimate momentum breakout. The buyer is committed.
Divergence with Price
When price makes a new local high but the Aggression Gauge makes a lower high — price is making new highs on declining buy-side pressure. The buyers needed to sustain the move are not as aggressive as they were at the prior high. This is a micro-level bearish divergence that often precedes short-term reversals or pullbacks.
The Exhaustion Spike
A sharp spike to 85–90 followed by an immediate drop back to 50–55 often marks selling exhaustion — aggressive buyers just cleared a large ask wall or triggered a cascade of short covering, and the move runs out of fuel. These are common at the highs of momentum moves. Rather than chasing the spike, the opportunity is often on the reversal once the gauge collapses back toward neutral.
Spot/Perp CVD Divergence: Who Is Leading?
Understanding CVD
Cumulative Volume Delta (CVD) is the running sum of aggressive buying minus aggressive selling, anchored to a reference point. When CVD is rising, buyers are consistently more aggressive than sellers. When CVD is falling, sellers are the dominant aggressive force. The absolute level of CVD is less important than its direction and rate of change.
AIO Terminal calculates CVD separately for two markets: Binance USDⓈ-M Perpetual Futures (the perp) and Binance Spot. The divergence line is the difference: Perp CVD − Spot CVD.
Reading the Colors
The CVD panel displays two running lines and a divergence indicator. The color convention tells you the directional story at a glance:
- Green / rising divergence line: Perp CVD is outpacing Spot CVD — futures traders are accumulating faster than spot buyers. This is a positive divergence: bullish signal. The market's more leveraged, better-informed participants are leaning long.
- Red / falling divergence line: Perp CVD is falling faster than Spot CVD — futures traders are selling (or not buying) while spot holds steady. Negative divergence: bearish signal. Futures players may be distributing into retail spot strength.
- Flat / near-zero: Both markets moving in sync — no meaningful divergence. No directional edge from this signal alone.
Why Spot vs. Perp Divergence Matters
Spot and perpetual futures trade the same underlying asset, so in an efficient market, informed buying or selling should appear in both markets simultaneously. When they diverge, it tells you something about who is acting and in which market:
- Perp CVD rising faster than Spot CVD (green, positive divergence): Futures traders are accumulating aggressively while spot buyers are not yet positioned. This is typically bullish — futures traders are often more sophisticated and better-informed. They may be front-running a move that spot buyers will join later.
- Spot CVD rising faster than Perp CVD: Retail and spot traders are buying, but futures professionals are not. This is often seen during retail-driven pumps that institutional futures traders are using to distribute into. Proceed with caution.
- Perp CVD falling while Spot holds steady (red, negative divergence): Futures traders are selling (or covering) while spot holders are not selling. This is a hedging or short-building pattern — futures players are positioning for a down move they believe is coming.
- Both falling together: Across-the-board distribution. No divergence, but significant selling pressure in both markets.
Session Anchoring
AIO Terminal anchors both CVD lines to the session start. This means the values reset at the beginning of each day and grow (or shrink) from zero. The absolute value at any point reflects the net directional pressure accumulated since the session open — making the readings consistent and comparable day to day without drift from historical data.
A Worked Example: CVD Divergence Before a Move
Consider this scenario during a BTC session:
- Price is ranging between $65,000 and $65,800 for 3 hours. Neither side is breaking out.
- Over the last 45 minutes, Perp CVD has been steadily rising — buyers are incrementally more aggressive in futures. Spot CVD is flat.
- The divergence line is climbing — a positive and growing gap between perp buying and spot buying.
- Smart Tape shows several $150k–$300k BUY trades in futures over this period, but nothing unusual in spot.
- Aggression Gauge is holding at 58–62 — above neutral, but not spiked.
This is a classic institutional accumulation pattern: a large buyer is building a futures position during a range, not yet willing to pay up aggressively (hence no sweeps and no Aggression spike), but consistently taking the offer over time. The divergence signals they are positioning for a move higher — which, when the range breaks, will be backed by genuine futures flow.
The breakout, when it comes, will be one where you have pre-positioned context rather than reacting to the candle close. That is the edge these tools provide.
Combining All Three: A Complete Flow Reading
Each of these three tools answers a different question. The highest-conviction trade setups are when all three align:
| Signal | Bullish Reading | Bearish Reading |
|---|---|---|
| Smart Tape | BUY trades & BUY SWEEPS | SELL trades & SELL SWEEPS |
| Aggression Gauge | Above 62, sparkline rising | Below 38, sparkline falling |
| Spot/Perp CVD | Perp CVD leading Spot CVD higher | Perp CVD falling faster than Spot |
A bullish confluence: Smart Tape showing BUY SWEEPS, Aggression at 70+, and Perp CVD diverging upward from Spot CVD. This is as high a confidence real-time long signal as these tools can produce. A bearish confluence is the mirror image.
Mixed signals — for example, Aggression is high but Perp CVD is flat or falling — indicate uncertainty. In those cases, the right response is often to reduce size or wait for clearer alignment rather than forcing a trade on partial confirmation.
AIO Terminal: Full Flow Analytics Included Free
Smart Tape, Aggression Gauge, Spot/Perp CVD, and Risk Score are all part of the Analytics tab — included free with every VIP plan. No additional subscriptions. No separate tools.
Explore Analytics Tab →Configuration for Your Trading Style
- Scalpers (1m–5m): Set Smart Tape threshold lower (20–30k for most pairs) to catch medium-size flow that moves markets at your timeframe. Watch Aggression Gauge for 30-second swings.
- Intraday traders (15m–1h): Default settings work well. Focus on CVD divergence building over 30–60 minute periods. Look for Aggression confirmations on breakout candles.
- Swing traders (4h–daily): Use the tools primarily for entry timing within your daily structure. Don't over-weight 1-minute Aggression readings for a trade you plan to hold for days.
Getting Started
All three tools are in the Analytics tab (key 8 on your keyboard, or click the Analytics tab in the AIO Terminal navigation). Select your symbol — the data streams immediately from Binance WebSocket. All panel settings are auto-saved.
If you're new to AIO Terminal, access is included free with any VIP plan. Contact us on Telegram (@nguyenthl) after subscribing to get your terminal credentials.
For a complete overview of all 8 Analytics panels, including Order Book heatmap, Time Heatmap, and Risk Score, see the full Analytics tab guide.