Analytics
AIO Terminal Trade Journal: Exact R-Multiples, MAE/MFE, Edge & Tags
A trading journal only tells you the truth if the numbers in it are exact. Most journals ask you to type in your stop-loss after the fact — which means the R-multiple you calculate is a guess dressed up as a statistic. AIO Terminal's Journal doesn't have that problem, because it's the same tool that placed the stop.
Not the Same Thing as the Free Journal Tool
If you've used AIO Indicator's free trade journal calculator, this is a different product built for a different purpose. The free tool is a manual, local-storage calculator — you type in your entries, exits, and (optionally) the worst/best price reached, and it computes stats in your browser with nothing ever sent to a server. The Terminal Journal covered in this article is automatic: it's wired directly into your live AIO Terminal order flow, records every fill without you touching anything, and because the terminal itself placed your stop-loss, its R-multiple and MAE/MFE numbers are exact rather than self-reported.
It Writes Itself
There's no "add trade" button. The Journal opens a record on your first entry fill, averages in any scale-ins, records partial exits as they happen, and closes the trade the moment your position size returns to zero. You trade normally in the Long, Short, Smart TP/SL, Close, and Cancel tabs — the Journal is a byproduct of that activity, not a separate task.
Why the R-Multiple Is Actually Exact
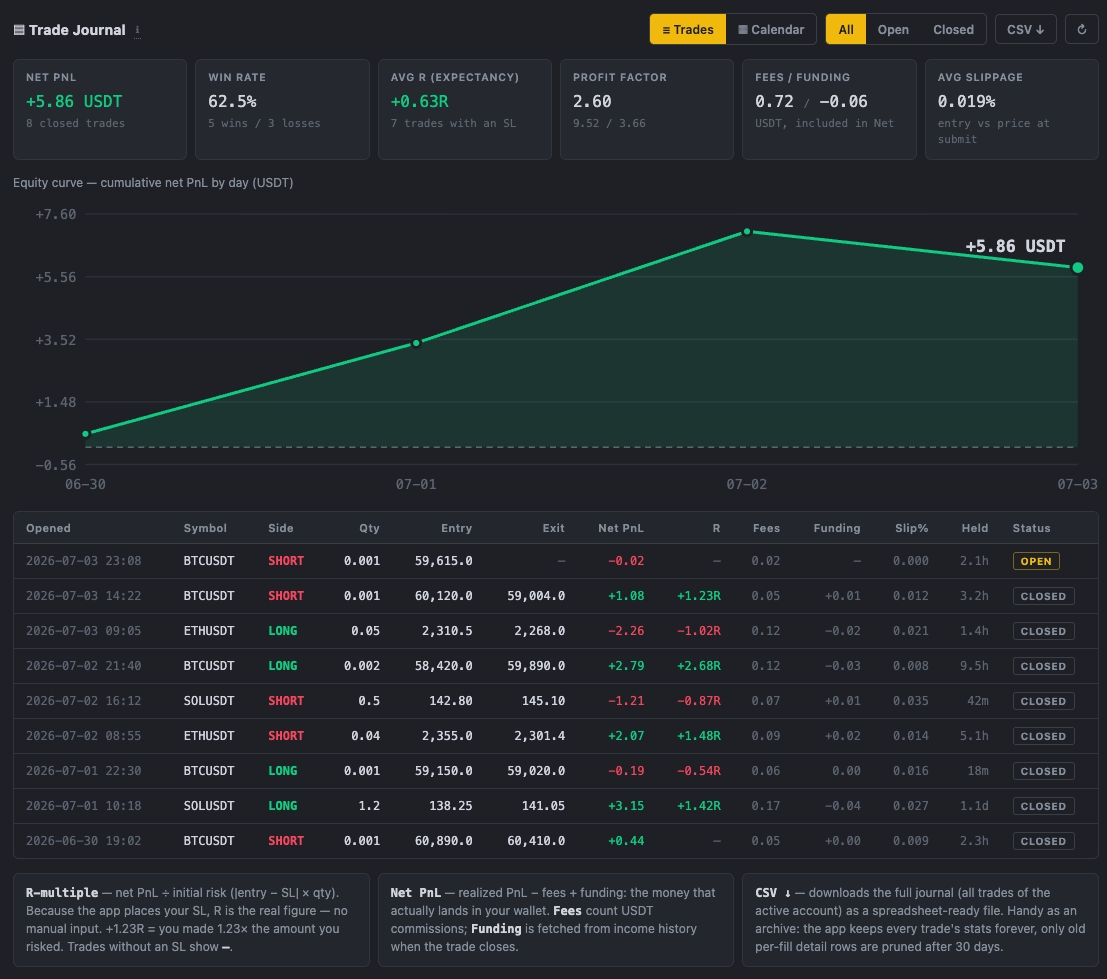
R-multiple is net P&L divided by initial risk — but that formula is only as good as the "initial risk" figure feeding it. Most journals rely on you remembering and correctly typing in the stop-loss you had in mind at entry, after the trade is already over. AIO Terminal doesn't have to ask, because it placed that stop-loss itself when the trade opened: R = net PnL ÷ (|avg entry − initial SL| × qty), computed from the actual order, not a recollection.
Alongside R, every closed trade also records slippage against the price you actually submitted at (mark price for a market order, your limit price for a limit order) and the funding paid or received, fetched at close. Both feed into a set of summary tiles: Net PnL, Win rate, Avg R (your expectancy), Profit factor, Fees, Funding, and Avg slippage.
MAE/MFE: What Your P&L Alone Doesn't Show You
Two trades can close for the identical profit and tell completely different stories. One moved straight to target. The other dipped hard against you first, and you happened to hold on. Same P&L, very different risk taken. MAE (Maximum Adverse Excursion) and MFE (Maximum Favorable Excursion) capture that difference — how far price moved against you, and in your favor, before the trade closed.
AIO Terminal samples this continuously from its own live mark-price feed for the entire time a trade is open, then persists the final MAE/MFE values at close. This is precisely why it needs to be the same tool executing your trades: a journal that only sees the entry and exit price, with no continuous feed in between, cannot reconstruct MAE/MFE after the fact — commercial journaling tools without their own live execution simply can't reproduce this. A closed trade with a small win but a deep MAE tells you your stop placement or entry timing was riskier than the final number suggests; a trade with high MFE that you exited early tells you something about how you manage winners.
Edge and Tags: Where Are You Actually Making Money?
Beyond the trade-by-trade table, two sub-tabs break your expectancy down by dimension instead of leaving it as one aggregate number:
- Edge — expectancy grouped by hour-of-day and by weekday (in your browser's timezone). If your Avg R quietly falls apart every day after 2pm, or your Tuesday trades carry the account while Fridays bleed, this is where that shows up. Most traders have a sense of when they trade best; this replaces the sense with a number.
- Tags — free-text, comma-separated tags you attach to any trade, alongside notes. The Tags view then scores expectancy per tag, so "breakout," "pullback," and "revenge-trade-don't-do-this-again" can each get their own honest track record instead of blending into your overall stats.
Calendar and Equity Curve: The Shape of Your Trading
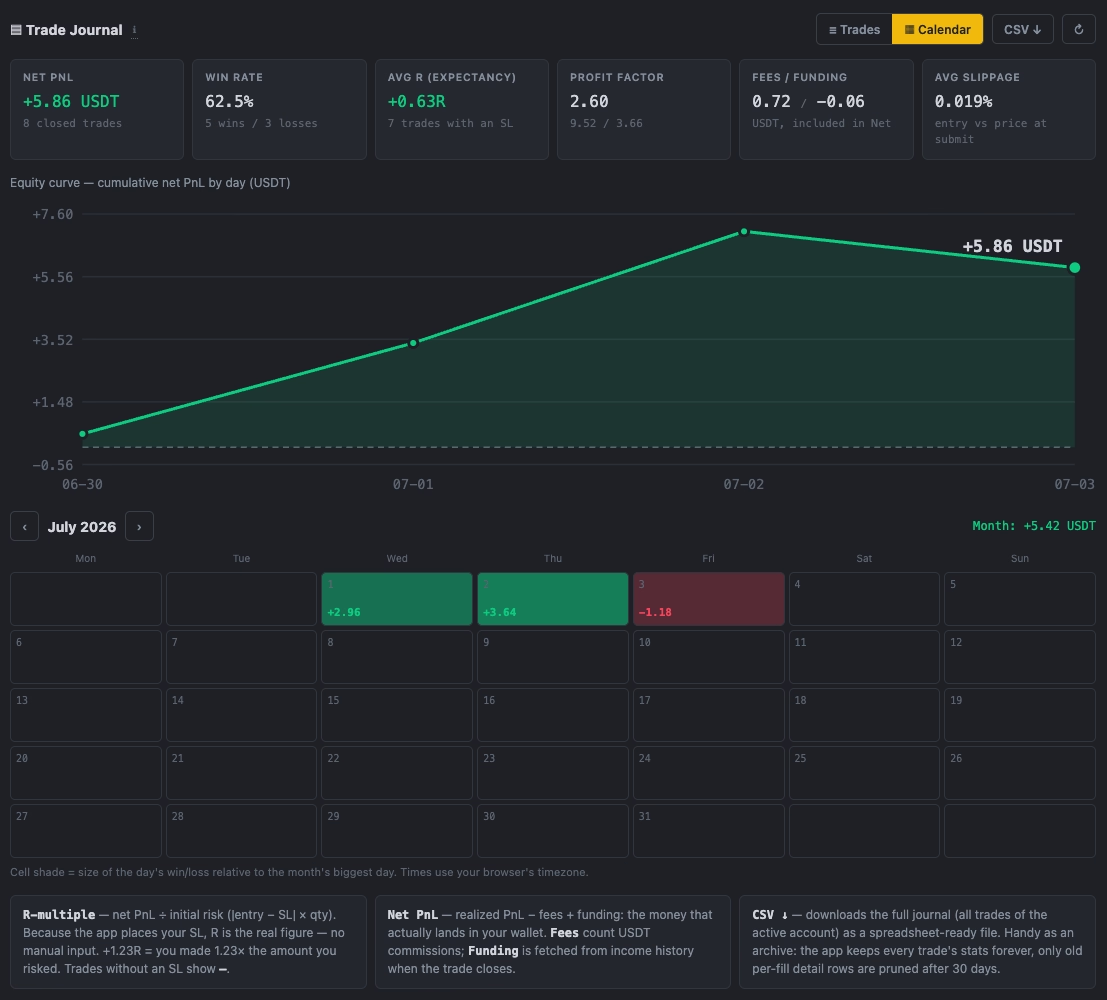
The Calendar view renders each day as a heat cell scaled to that month's best and worst day, with month navigation, a running month total, and a ring around today. It's a faster read of consistency than scrolling a trades table — long streaks of dull green versus a few days that made or broke the month are immediately visible. The Equity Curve is a cumulative daily-net line (red when it dips negative) with a crosshair tooltip, giving you the shape of your account's growth rather than just its current total.
Filtering, Row Limits, and Export
A Period selector (7D / 30D / 90D / All, plus a custom date range) applies consistently across the trades table, summary tiles, the Edge/Tags stats, and the equity curve — so you can ask "how have the last 30 days looked" without the calendar and the stats disagreeing with each other. Open trades always show regardless of the filter. The trades table itself shows your most recent 100 by default with a "Showing N trades" line and a Load more button, so a long history is never silently cut off — up to 1,000 rows load on demand. Every field, including MAE, MFE, and tags, is available in a full CSV export for anyone who wants to run their own analysis outside the terminal.
A Practical Weekly Review
- Set the Period filter to 7D and check Avg R and Profit factor first — is the week net positive on a per-trade basis, not just in total dollars?
- Open the Edge tab — is there an hour or weekday clearly dragging the average down? That's a candidate for a rule, not just a note-to-self.
- Sort the trades table by MAE — the trades with the deepest adverse excursion relative to their eventual outcome are the ones worth re-examining, win or lose.
- Check the Tags view for your highest- and lowest-expectancy setups. Consider sizing down or retiring whichever tag is a consistent loser.
- Export to CSV monthly as your own backup and archive — fill-level detail beyond 30 days is aggregated, so CSV is your record of the underlying trades.
Getting Started
Journal is on keyboard shortcut 9. It requires no setup — it starts recording from your very next fill in Long, Short, Smart TP/SL, Close, or Cancel. Tags and notes can be added to any trade directly from the Trades table.
If you're new to AIO Terminal, access is included free with any VIP plan. Contact us on Telegram (@nguyenthl) after subscribing to receive your terminal credentials.
Note: the Journal reports what already happened — it doesn't predict what happens next. Expectancy computed from a small number of trades is noisy; treat the Edge and Tags breakdowns as a prompt to investigate, not a verdict after ten trades.